What is the Population of GM (table 1)
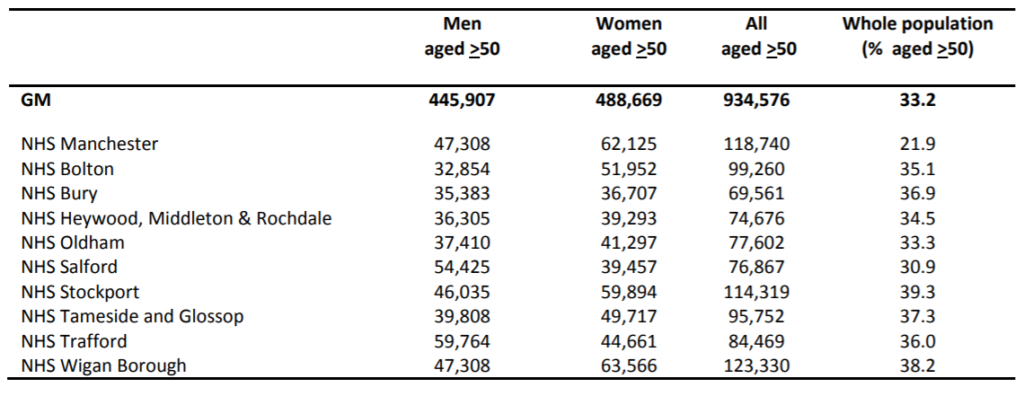
Approximately 2.8 million people live in GM of whom 33.2% are aged 50 and over (table 1). This cohort of around one million will be the target of the MARS Public Health Framework. Within this population, 330 000 have the chronic diseases that potentially lead to an amputation and will require a more targeted and personalised public health strategy. It is interesting to note that Manchester CCG (formerly North, Central and South Manchester CCGs) has a much younger population profile as only 21.9% are aged 50 and over. The denominator population upon which numbers and costs are based is shown in table 1.
Table 1: The 2016 mid-year population estimate of GM CCGs; men and women aged 50 and over and total population (all ages)
What is the prevalence (table 2) and number (table 3) of people with diabetes and Peripheral arterial disease (PAD) across GM?
The number of people with diabetes and PAD regionally can be estimated by applying epidemiological data to this population. Fowkes et al’s recent meta-analysis and the Health and Lifestyle survey of England 2014 have been used to estimate the number of people with PAD and known diabetes respectively (table 2).
Table 2: Percentage prevalence of PAD and diabetes by age group; men and women aged 50 and over2-3
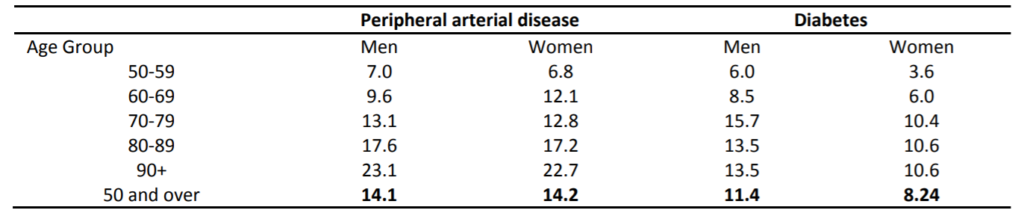
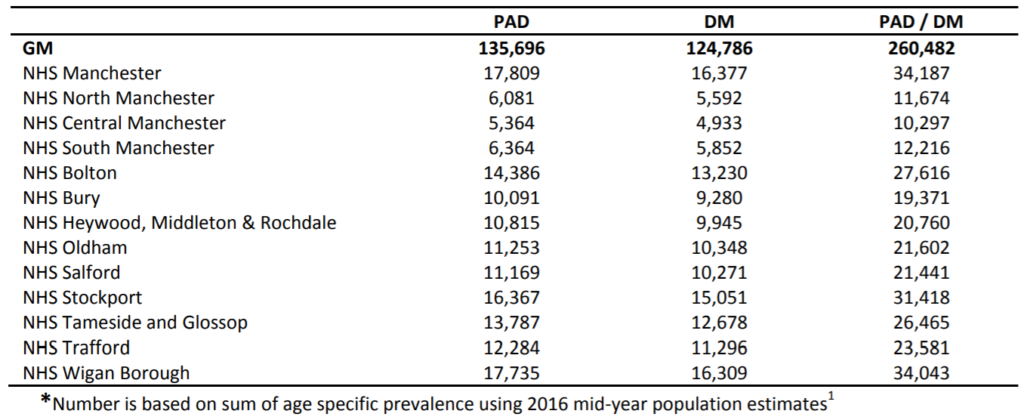
Applying these age specific prevalence rates to the GM population shows there to be approximately 260 000 cases of either PAD or diabetes (table 3).
Table 3; Number of PAD and Diabetes (DM) cases across GM CCGs; men and women aged 50 and over*
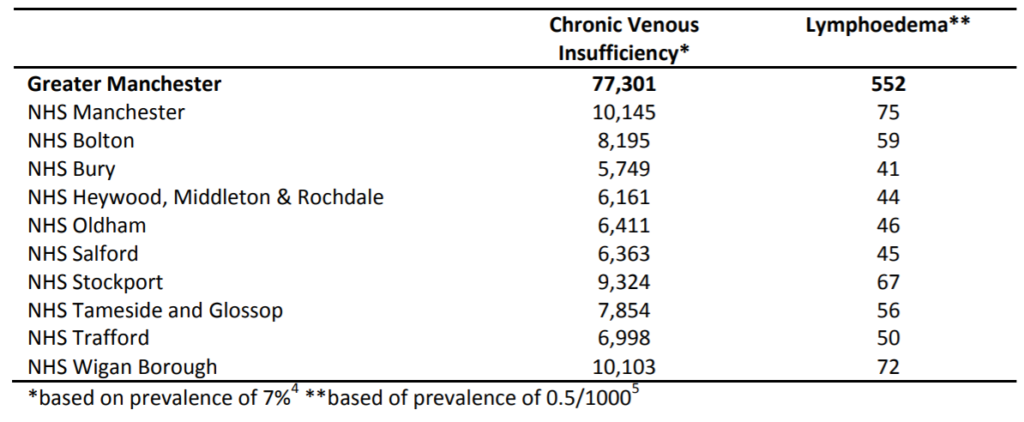
What is the prevalence and number with lower limb venous disease and lymphoedema across GM (table 4)?
Unfortunately, accurate and up to date prevalence data for venous ulceration and lymphoedema by age group is not readily available. This is because of the wide variation in definition, diagnostic criteria and populations. The prevalence of chronic venous insufficiency varies significantly but is thought to be around 7% of the adult population.4 Lymphoedema is much less common and usually associated with cancer. However, lower limb lymphoedema secondary to conditions such as obesity, deep vein thrombosis, infection and leg ulcers occur and often lead to repeated episodes of hospital admission with cellulitis. The prevalence of this type of lymphoedema i.e. non cancer is not known but is estimated to be in the region of 0.5/1000.5
Applying these estimates to the GM population aged 50 and over provides an additional 80 000 cases (table 4).
Table 4: Number of chronic venous insufficiency and lower limb lymphoedema cases across GM Clinical Commissioning Groups; men and women aged 50 and over
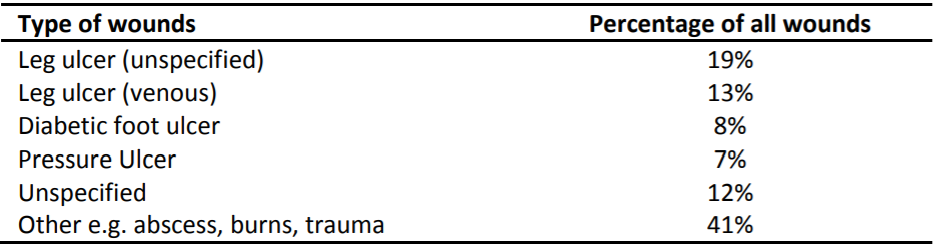
What are the different types of lower limb ulcers (table 5)?
Whilst the majority of lower limb ulcers that lead to an amputation are secondary to PAD and diabetes, overall the majority of ulcers in the community are actually venous. The underlying diagnosis of chronic lower limb wounds was investigated by Guest et al who described one third of all wounds in primary care being due to venous ulcers. Indeed, there were three times as many venous than diabetic foot ulcers. Non diabetic foot ulcers i.e. those relating to PAD were not measured directly but likely included in the ‘unspecified’ classification (table 5).
Table 5: Classification of chronic wounds in general practice
The cost of managing these wounds to the NHS, based on extrapolating this data at 2013/2014 prices was £6bn. This figure and the burden of wounds was debated in the House of Lords in November 2017 where it was concluded that the burden of wounds on the NHS was greater than that of obesity and that a national strategy was required.
What is the cost of managing chronic lower limb wounds (tables 6-7)?
The cost of managing chronic wounds is rising as a result of rising prevalence (estimated at 12% rise per year), NHS inflation and population growth. The main costs associated with managing wounds are drug prescriptions, community nurse visits and hospital visits (table 6).
Table 6: Distribution of costs (percentage of total) for the management of acute, chronic and unspecified wounds
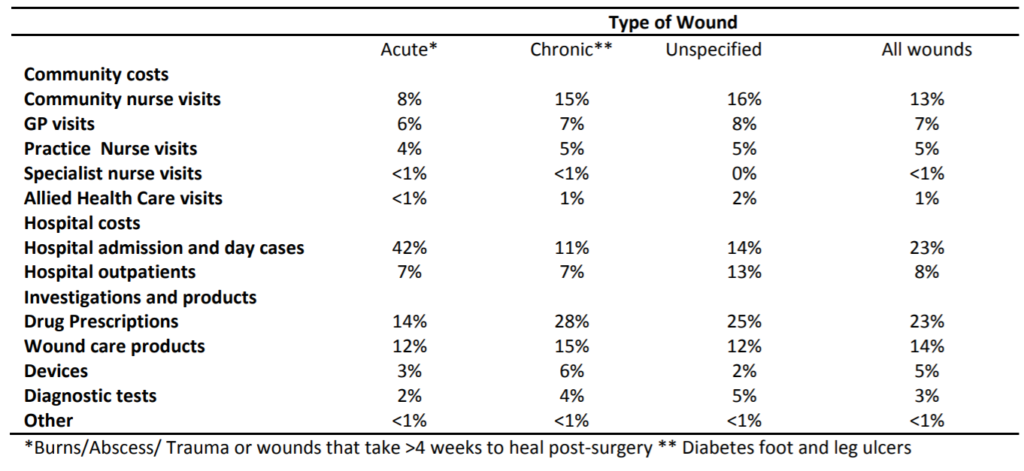
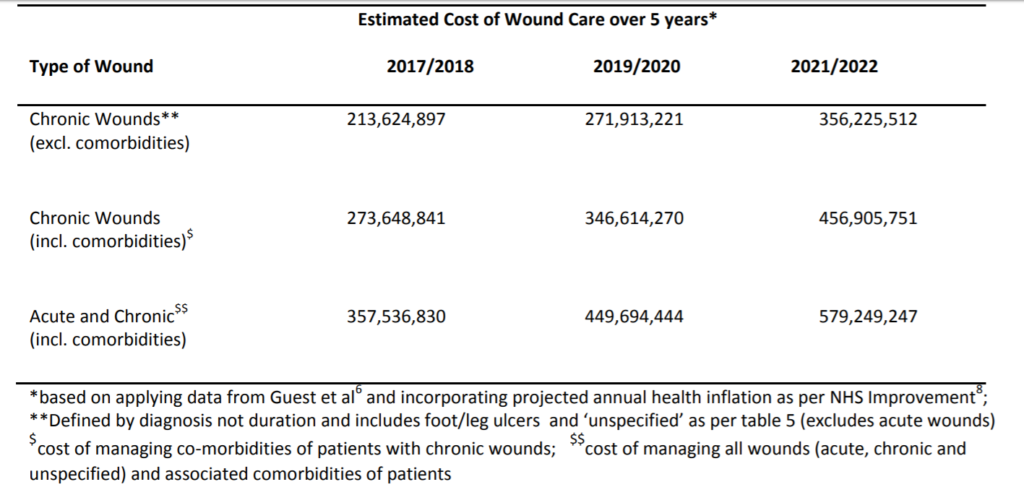
Table 7 highlights the cost of chronic wound care was £213m in 2017/2018 and is expected to rise to £356m by 2021/22. The management of these patients’ co-morbidities will require an additional £100m by 2021/22. These figures show the importance of not only reducing the prevalence of chronic wounds but better treating and indeed preventing the co-morbidities that give rise to these ulcers.
Table 7: Rising cost of wound care in GM 2017/18 to 2021/22
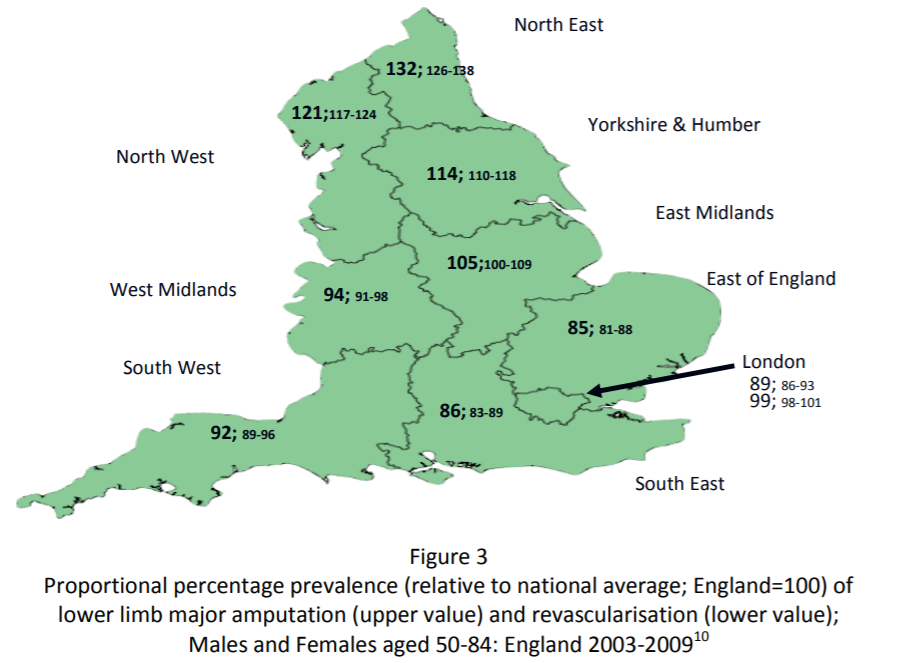
What is the national amputation challenge (figure 3)?
The prevalence of major amputation in England, among those aged 50 and over, is, approximately 26/100 000.10 however rates across England vary by 50% with prevalence higher in Northern England compared with the South.
- Above to below knee amputation ratio (a potential marker of poor care) is higher in Northern regions (North 1.3:1, Midlands 1.2:1, South 0.9:1).
- Amputation rates are three times higher in men compared with women
- Amputation rates are 70% higher in Black than white populations.
- Half of amputations are in people with no diabetes with the additional main cause being PAD i.e. atherosclerosis.
- Fortunately, over the last ten years (2003-2013), major amputation rates have fallen by 18%, however, regional and gender inequalities remain. Additionally, minor amputation rates i.e. those below the ankle have risen by 18% with this rise attributable to men without diabetes.
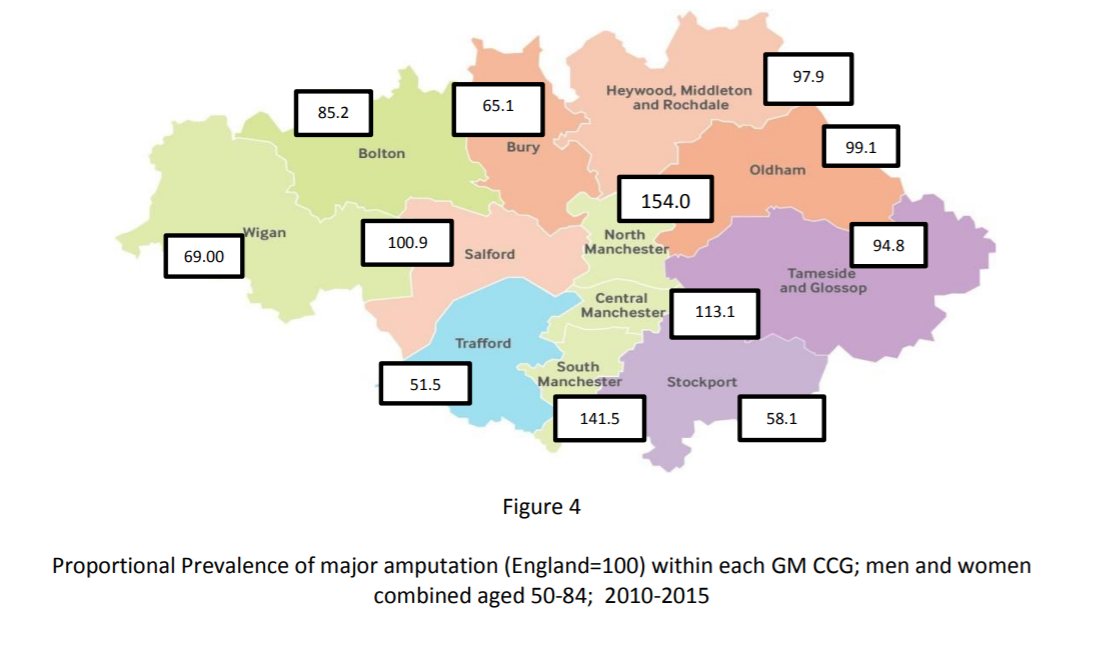
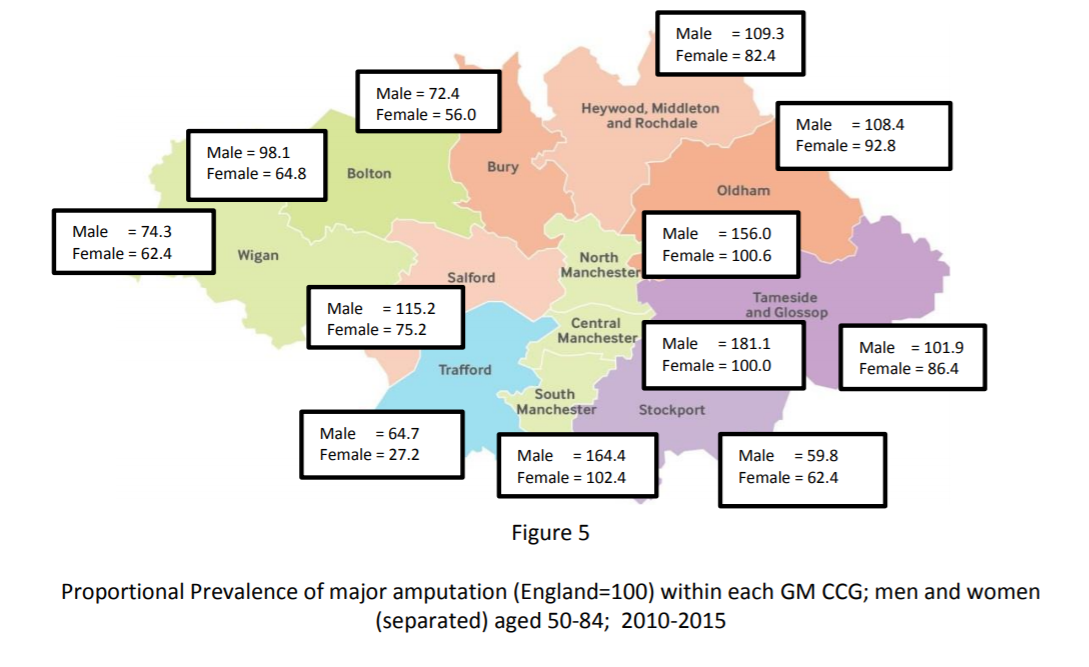
What is the GM amputation challenge (fig 4 & 5)?
The national inequalities surrounding amputation are also evident within GM Data sourced from the ‘Ability Centre’ which records all major amputations in GM.15 Overall prevalence of major amputation for those aged 50-84 is 36% above the current national average (22.9 vs 31.5/100 000) with rates over three times higher in men than women (men 48.9, women 15.0). Whilst the overall prevalence is above the national average, locality rates vary widely. The proportional prevalence relative to the national rate in each area is shown in the map below. The centre of GM has rates well above the national average, the East has rates in line with the of the national average with Western and Southern rates below the national average.
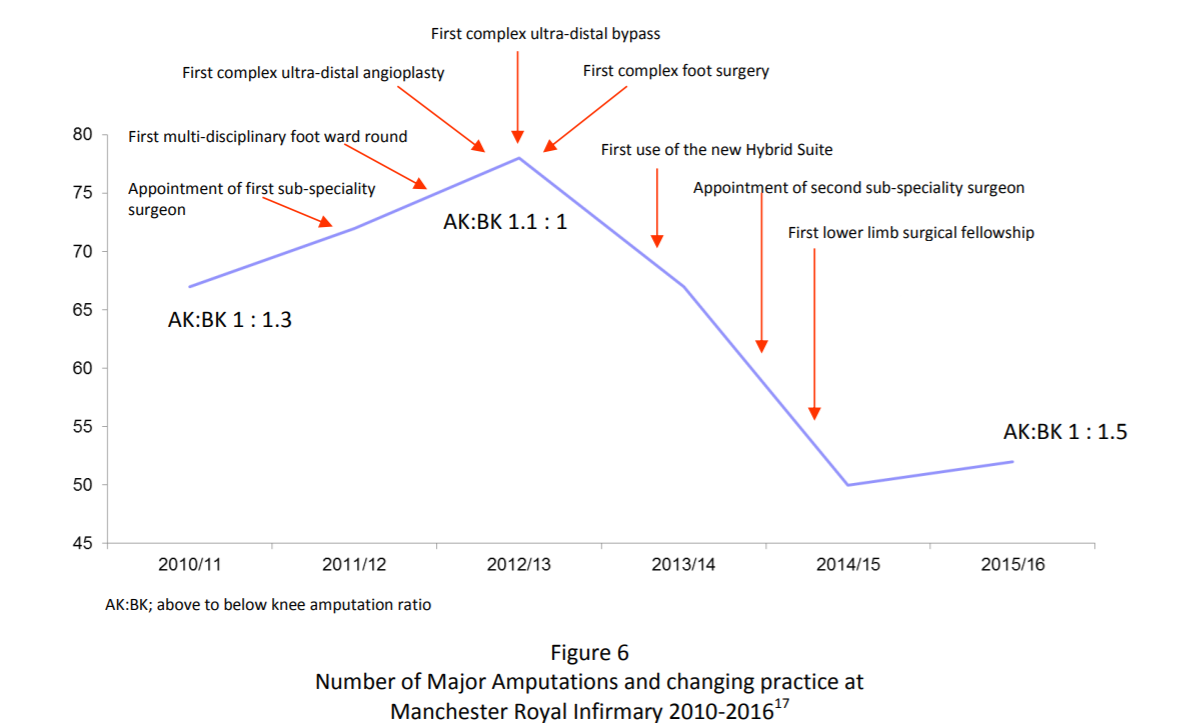
Are there regional examples of recognised excellence (fig 6)?
GM has nationally recognised areas of excellence of which Salford’s community vascular triage service has been highlighted by NICE. A similar program exists in North Manchester. These have been shown to be cost effective in reducing referrals to hospitals and treating claudication.
The development of the ‘Lower Limb Preservation Team’ at Manchester Vascular Centre
(Manchester Royal Infirmary) has led to the reduction in major amputations of 23% within three years along with a much improved above to below knee amputation ratio.
This shows that changing hospital practice is key to short term gains, medium term gains are made through earlier diagnosis and treatment in the community with long term gains made by improvements in Public Health.
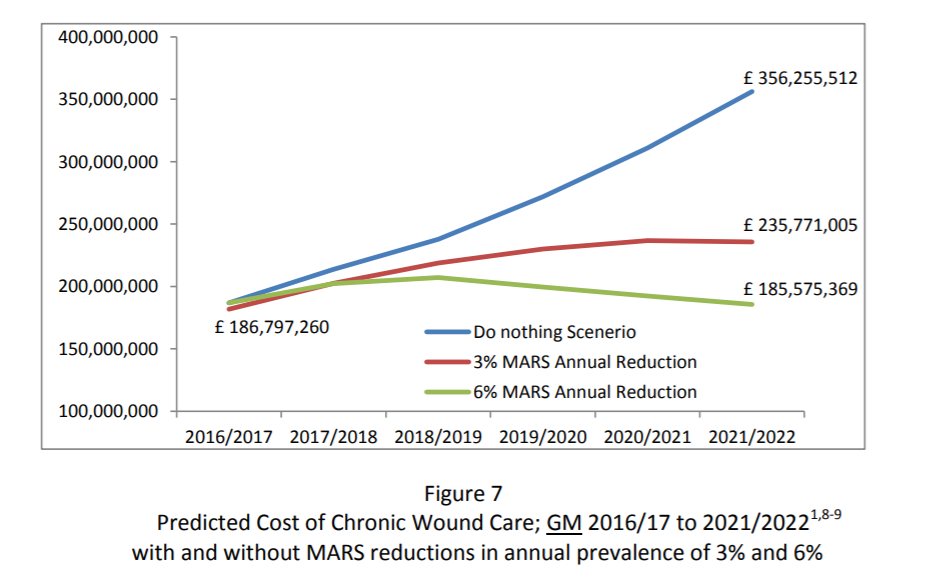
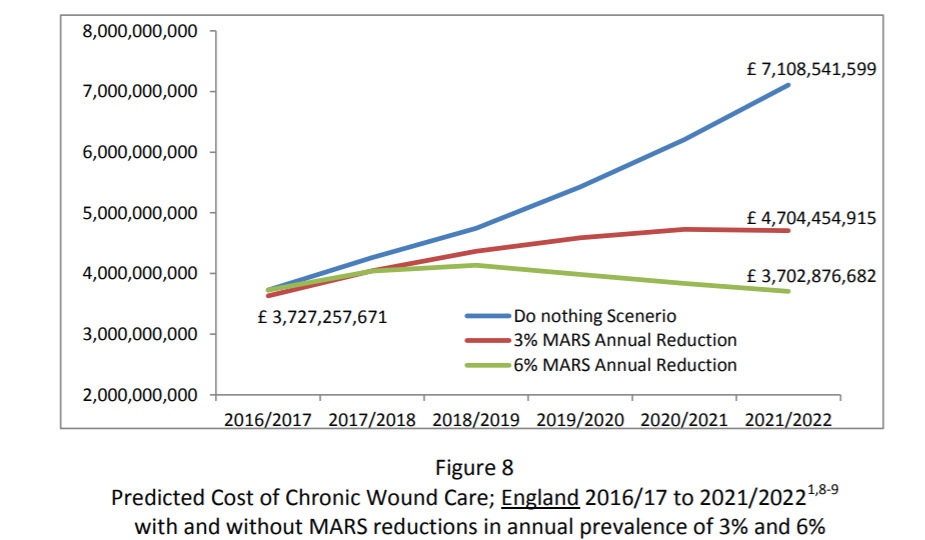
What is the cost of chronic wound care in GM (fig 7) and England (fig 8)?
The cost of diabetic foot wounds at 2010/11 prices was estimated to be £600m with all diabetic and venous ulcers estimated at £2bn at 2014/15 prices. A recent debate in the House of Lords quoted the cost of chronic wounds in England to be greater than that of obesity especially as the the prevalence of chronic wounds is rising at approximately 12% per year. Costs associated with managing chronic wounds in GM have been estimated based on prevalence and costs as described by Guest et al and projected forward using NHS Inflation predictors and the 2016 population estimate. The cost of chronic wound care to GM and England extrapolated to 2022 is shown for Greater Manchester (figure 7) and England (Figure 8). The saving Greater Manchester can expect from reducing prevalence by 3% per year sustained for 5 years is £70m (figure 7).
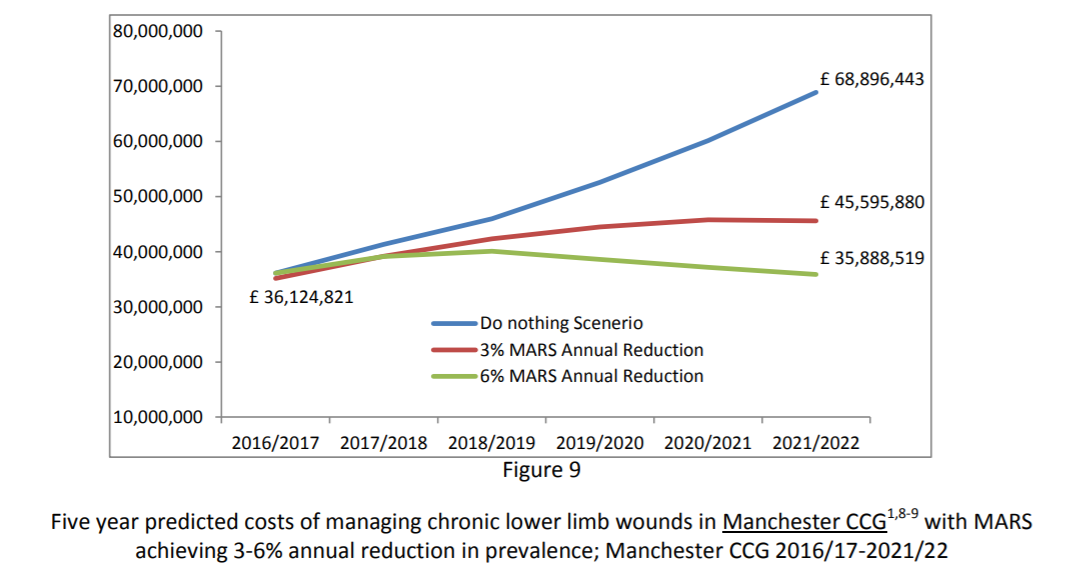
Cost of Wound Care in one regional Clinical Commissioning Group – Manchester CCG (fig 9)
Manchester CCG formed in April 2017, through the amalgamation of North, Central and South Manchester CCGs serves a relatively young, economically deprived and ethnically diverse population compared with GM as a whole. The cost of chronic wound care here is highlighted in Figure 9. A reduction of 15% within five years will results in annual savings of £23m.